
Appendix 6: Workload Statistics
Federal Court of Australia Annual Report 2010-2011
 PDF version
The statistics in this appendix provide comparative historical information on the work of the Court, including in certain areas of the Court's jurisdiction.
When considering the statistics it is important to note that matters vary according to the nature and complexity of the issues in dispute.
It should also be noted that the figures reported in this report may differ from figures reported in previous years. The variations have occurred through refinements or enhancements to the Casetrack database which necessitated the checking or verification and possible variation of data previously entered.
Casetrack records matters in the Court classified according to sixteen main categories, described as 'causes of action' (CoA). The Court presently reports on filings by major CoA. This is an under-representation of the workload as it does not include filings of supplementary CoA's (cross appeals and cross claims), interlocutory applications (initiated by the filing of a notice of motion) or Native Title joinder of party applications. In 2007–08 the Court started to count and report on notices of motion in appellate proceedings in order to provide the most accurate possible picture of the Court's appellate workload. From 2008–09 the Court has counted all forms of this additional workload in both its original and appellate jurisdictions.
Table 6.4 on page 87 provides a breakdown of these matters. At this stage it is not possible to obtain information about finalisations of notices of motion (because they are recorded in the Court's case management system as a document filed rather than a specific CoA). Because of this, detailed reporting of these matters has been restricted to the information about appeals in Part 3 and Table 6.4. All other tables and figures in this Appendix and through the Report are based on major CoA.
Table 6.1 - Summary of Workload Statistics - Original and Appellate Jurisdictions
Filings of Major CoAs (including Appellate and Related Actions)
| Cause of Action | 2006-07 | 2007-08 | 2008-09 | 2009-10 | 2010-11 |
|---|---|---|---|---|---|
| Total CoAs | |||||
| Filed | 4925 | 4428 | 3862 | 3646 | 4941 |
| Finalised | 5229 | 4737 | 4131 | 3533 | 4648 |
| Current | 3228 | 2919 | 2650 | 2763 | 3056 |
| Corporations | |||||
| Filed | 1926 | 1695 | 1673 | 1676 | 2838 |
| Finalised | 2087 | 1682 | 1745 | 1396 | 2543 |
| Current | 518 | 531 | 459 | 739 | 1034 |
| Bankruptcy | |||||
| Filed | 282 | 247 | 208 | 188 | 217 |
| Finalised | 343 | 263 | 236 | 169 | 205 |
| Current | 120 | 104 | 76 | 95 | 107 |
| Native Title | |||||
| Filed | 66 | 33 | 42 | 36 | 83 |
| Finalised | 93 | 73 | 92 | 68 | 91 |
| Current | 586 | 546 | 496 | 464 | 456 |
| Total CoAs (excluding Corporations, Bankruptcy & Native Title) | |||||
| Filed | 2651 | 2453 | 1939 | 1746 | 1803 |
| Finalised | 2706 | 2719 | 2058 | 1900 | 1809 |
| Current | 2004 | 1738 | 1619 | 1465 | 1459 |
Table 6.2 - Summary of Workload Statistics - Excluding Appeals and related actions
Filings of Major CoAs (excluding Appeals and Related Actions)
| Cause of Action | 2006-07 | 2007-08 | 2008-09 | 2009-10 | 2010-11 |
|---|---|---|---|---|---|
| Total CoAs (excl. Appeals & Related Actions) | |||||
| Filed | 3543 | 3074 | 2988 | 2951 | 4303 |
| Finalised | 3846 | 3257 | 3206 | 2782 | 4036 |
| Current | 2697 | 2514 | 2296 | 2465 | 2732 |
| Corporations (excl. Appeals & Related Actions) | |||||
| Filed | 1903 | 1678 | 1636 | 1642 | 2797 |
| Finalised | 2065 | 1662 | 1717 | 1370 | 2499 |
| Current | 506 | 522 | 441 | 713 | 1011 |
| Bankruptcy (excl. Appeals & Related Actions) | |||||
| Filed | 223 | 201 | 148 | 127 | 144 |
| Finalised | 289 | 205 | 172 | 128 | 130 |
| Current | 87 | 83 | 59 | 58 | 72 |
| Native Title (excl. Appeals & Related Actions) | |||||
| Filed | 50 | 27 | 37 | 33 | 73 |
| Finalised | 80 | 63 | 87 | 63 | 82 |
| Current | 576 | 540 | 490 | 460 | 451 |
| Total CoAs (excl. Appeals & Related Actions & excluding Corporations, Bankruptcy & Native Title) | |||||
| Filed | 1367 | 1168 | 1167 | 1149 | 1289 |
| Finalised | 1412 | 1327 | 1230 | 1221 | 1325 |
| Current | 1528 | 1369 | 1306 | 1234 | 1198 |
Table 6.3 - Summary of Workload Statistics - Appeals and Related Actions only
Filings of Appeals and Related Actions
| Cause of Action | 2006-07 | 2007-08 | 2008-09 | 2009-10 | 2010-11 |
|---|---|---|---|---|---|
| Total Appeals & Related Actions | |||||
| Filed | 1382 | 1354 | 874 | 695 | 638 |
| Finalised | 1383 | 1480 | 925 | 751 | 612 |
| Current | 531 | 405 | 354 | 298 | 324 |
| Corporations Appeals & Related Actions | |||||
| Filed | 23 | 17 | 37 | 34 | 41 |
| Finalised | 22 | 20 | 28 | 26 | 44 |
| Current | 12 | 9 | 18 | 26 | 23 |
| Migration Appeals & Related Actions | |||||
| Filed | 1050 | 997 | 515 | 376 | 254 |
| Finalised | 1079 | 1099 | 615 | 421 | 267 |
| Current | 342 | 240 | 140 | 95 | 82 |
| Native Title Appeals & Related Actions | |||||
| Filed | 16 | 6 | 5 | 3 | 10 |
| Finalised | 13 | 10 | 5 | 5 | 9 |
| Current | 10 | 6 | 6 | 4 | 5 |
| Total Appeals & Related Actions (excl. Corporations, Migration & Native Title Appeals & Related Actions) | |||||
| Filed | 293 | 334 | 317 | 282 | 333 |
| Finalised | 269 | 351 | 277 | 299 | 292 |
| Current | 167 | 150 | 190 | 173 | 214 |
Table 6.4 - Summary of supplementary workload statistics
Filings of supplementary causes of action
| 2006-07 | 2007-08 | 2008-09 | 2009-10 | 2010-11 | |
|---|---|---|---|---|---|
| Total actions (excluding Appeals & Related Actions) | |||||
| Cross Appeals (original jurisdiction) | 11 | 2 | 5 | 6 | 3 |
| Cross Claims | 198 | 177 | 190 | 205 | 241 |
| Notices of Motion | 1713 | 1523 | 1525 | 1544 | 1794 |
| Native Title (NT) Joinder of party applications | 89 | 135 | 482 | 364 | 628 |
| Appeals & Related Actions | |||||
| Cross Appeals | 15 | 18 | 21 | 15 | 38 |
| Notices of Motion | 139 | 148 | 170 | 150 | 161 |
| Total actions (including Appeals & Related Actions) | |||||
| Cross Appeals | 26 | 20 | 26 | 21 | 41 |
| Cross Claims | 198 | 177 | 190 | 205 | 241 |
| Notices of Motion | 1852 | 1671 | 1695 | 1694 | 1955 |
| NT Joinder of party applications | 89 | 135 | 482 | 364 | 628 |
| Totals | 2267 | 2080 | 2478 | 2346 | 2963 |
Note: There was an error in the Notice of Motion (NoM) filings in the 2009-10 Annual Report. The filings included NoMs that had been voided by staff and thus were overstated. The error has been rectified and the above table more accurately reflects the filings for the last five financial years.
Finalisations of supplementary causes of action
| 2006-07 | 2007-08 | 2008-09 | 2009-10 | 2010-11 | |
|---|---|---|---|---|---|
| Total Actions (excluding Appeals & Related Actions) | |||||
| Cross Appeals (original jurisdiction) | 5 | 8 | 1 | 5 | 7 |
| Cross Claims | 208 | 217 | 174 | 171 | 160 |
| NT Joinder of party applications | 89 | 135 | 482 | 364 | 628 |
| Appeals & Related Actions | |||||
| Cross Appeals | 16 | 20 | 23 | 9 | 26 |
| Total actions (including Appeals & Related Actions) | |||||
| Cross Appeals | 21 | 28 | 24 | 14 | 33 |
| Cross Claims | 208 | 217 | 174 | 171 | 160 |
| NT Joinder of party applications | 89 | 135 | 482 | 364 | 628 |
| Totals | 318 | 378 | 671 | 537 | 821 |
Current Cross Appeals & Cross Claims as at 30 June 2011
| Appeals & Related Actions | |
|---|---|
| Cross Appeals | 33 |
| Total Supplementary CoAs (excluding Appeals & Related Actions) | |
| Cross Appeals (original jurisdiction) | 4 |
| Cross Claims | 342 |
| Total Supplementary CoAs (including Appeals & Related Actions) | |
| Cross Appeals | 37 |
| Cross Claims | 342 |
| Totals | 379 |
Figure 6.1 - Matters filed over the last five years
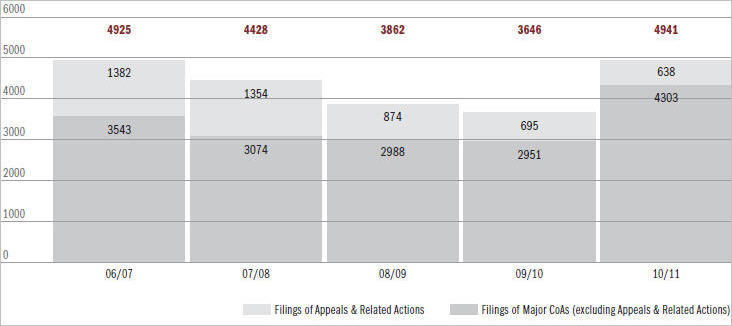
[Figure 6.1 – Matters filed over the last five years - text version]
| 2006/07 | 2007/08 | 2008/09 | 2009/10 | 2010/11 | |
|---|---|---|---|---|---|
| Filings of Major CoAs (excluding Appeals & Related Actions) | 3543 | 3074 | 2988 | 2951 | 4303 |
| Filings of Appeals & Related Actions | 1382 | 1354 | 874 | 695 | 638 |
| TOTAL | 4925 | 4428 | 3862 | 3646 | 4941 |
Figure 6.2 - Matters filed and finalised over the last five years
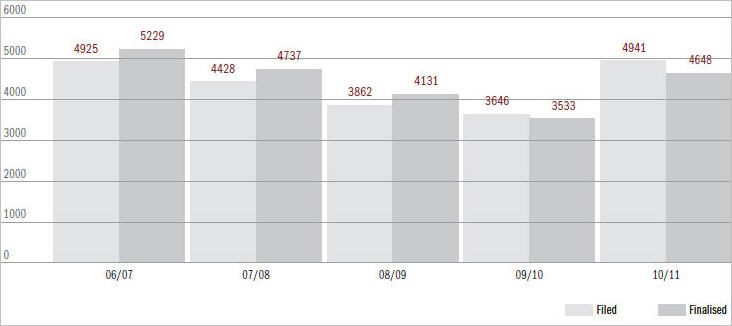
The number finalised refers to those matters finalised in the relevant financial year, regardless of when they were originally filed.
[Figure 6.2 – Matters filed and finalised over the last five years - text version]
| 2006/07 | 2007/08 | 2008/09 | 2009/10 | 2010/11 | |
|---|---|---|---|---|---|
| Filed | 4925 | 4428 | 3862 | 3646 | 4941 |
| Finalised | 5229 | 4737 | 4131 | 3533 | 4648 |
Figure 6.3 - Age and number of current matters at 30 June 2011
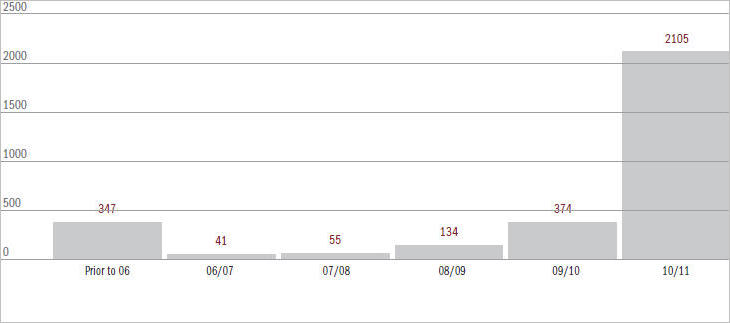
A total of 3056 matters remain current at 30 June 2011. There were 347 applications still current relating to periods before those shown in the graph. Over ninety-six per cent of cases prior to 2006 are native title matters.
[Figure 6.3 – Age and number of current matters at 30 June 2011 - text version]
| Prior to 06 | 06/07 | 07/08 | 08/09 | 09/10 | 10/11 |
|---|---|---|---|---|---|
| 347 | 41 | 55 | 134 | 374 | 2105 |
Figure 6.4 - Time span to complete - Matters completed (excl. native title) over the last five years
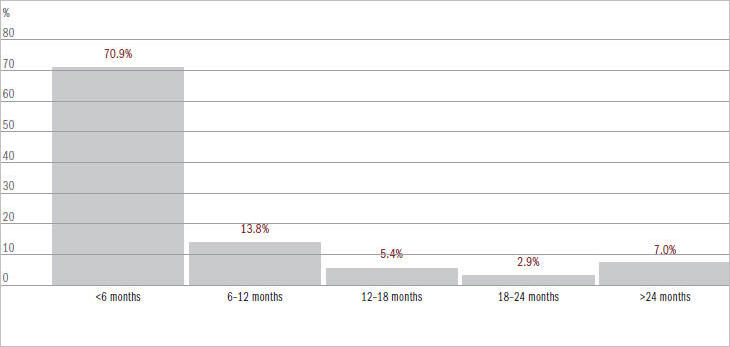
A total of 21 903 matters were completed during the five year period ending 30 June 2011, excluding native title matters. The time span, from filing to disposition of these matters, is shown in the graph above.
[Figure 6.4 – Time span to complete – Matters completed (excl. native title) over the last five years - text version]
| < 6 months | 6-12 months | 12-18 months | 18-24 months | > 24 months |
|---|---|---|---|---|
| 70.9% | 13.8% | 5.4% | 2.9% | 7.0% |
Figure 6.5 - Time span to complete against the benchmark (excl. native title) over the last five years
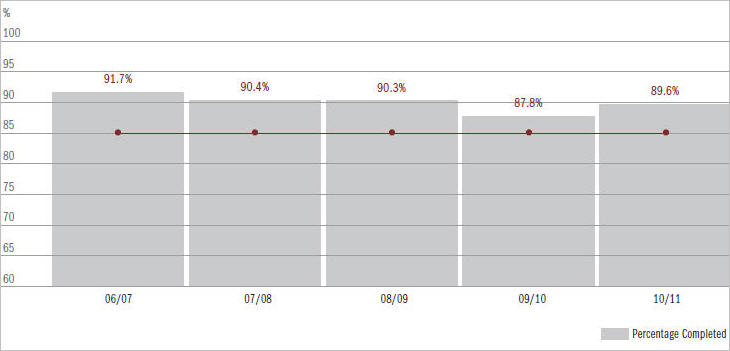
The Court has a benchmark of eighty-five per cent of cases (excluding native title) being completed within eighteen months of commencement. The above chart sets out the Court's performance against this time goal over the last five years. The total number of matters (including appeals but excluding Native Title) completed for each of the last five years and the time span for completion are shown below.
[Figure 6.5 – Time span to complete against the benchmark (excl. native title) over the last five years - text version]
| 06/07 | 07/08 | 08/09 | 09/10 | 10/11 | |
|---|---|---|---|---|---|
| Percentage completed | 91.7% | 90.4% | 90.3% | 87.8% | 89.6% |
Table 6.5 - Finalisation of major CoAs in accordance with 85% benchmark (including appeals and related actions and excluding native title matters)
| Percentage completed | 2006-07 | 2007-08 | 2008-09 | 2009-10 | 2010-11 |
|---|---|---|---|---|---|
| Under 18 months | 4722 | 4226 | 3653 | 3045 | 4089 |
| % of Total | 91.7% | 90.4% | 90.3% | 87.8% | 89.6% |
| Over 18 months | 427 | 448 | 391 | 425 | 477 |
| % of Total | 8.3% | 9.6% | 9.7% | 12.2% | 10.4% |
| Total CoAs | 5149 | 4674 | 4044 | 3470 | 4566 |
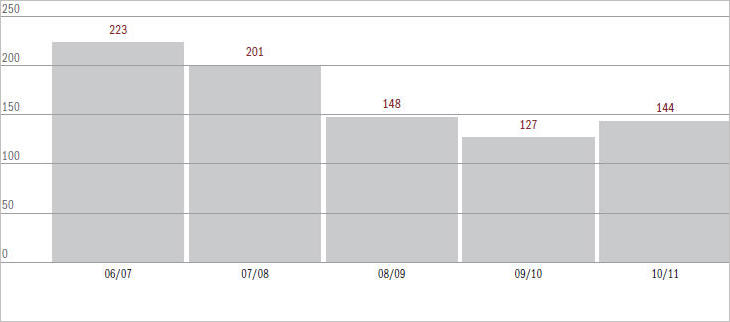
Figure 6.6 - Bankruptcy Act matters (excl. appeals) filed over the last five years
[Figure 6.6 – Bankruptcy Act matters (excl. appeals) filed over the last five years - text version]
| 06–07 | 07–08 | 08–09 | 09–10 | 10–11 |
|---|---|---|---|---|
| 223 | 201 | 148 | 127 | 144 |
Figure 6.6.1 - Current Bankruptcy matters (excl. appeals) by year of filing
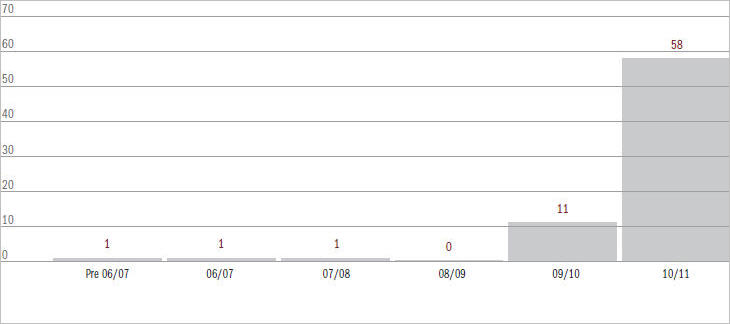
A total of 72 Bankruptcy Act matters remain current as at 30 June 2011.
[Figure 6.6.1 – Current Bankruptcy matters (excl. appeals) by year of filing - text version]
| Pre 06/07 | 06/07 | 07/08 | 08/09 | 09/10 | 10/11 |
|---|---|---|---|---|---|
| 1 | 1 | 1 | 0 | 11 | 58 |
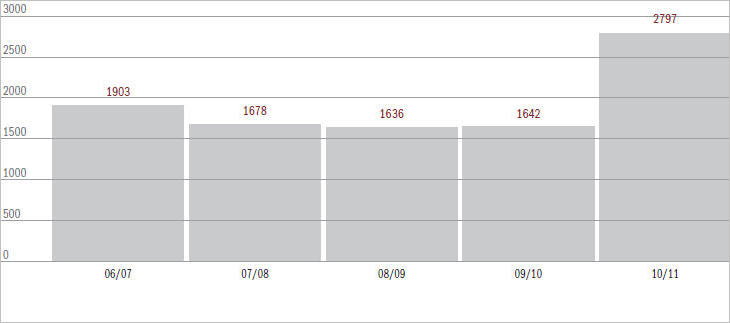
Figure 6.7 - Corporations Act matters (excl. appeals) filed over the last five years
[Figure 6.7 – Corporations Act matters (excl. appeals) filed over the last five years - text version]
| 06/07 | 07/08 | 08/09 | 09/10 | 10/11 |
|---|---|---|---|---|
| 1903 | 1678 | 1636 | 1642 | 2797 |
Figure 6.7.1 - Current Corporations Act matters (excl. appeals) by year of filing
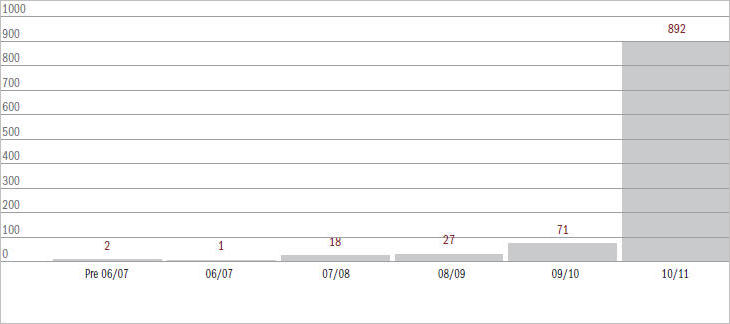
A total of 1011 Corporations Act matters remain current as at 30 June 2011.
[Figure 6.7.1 – Current Corporations Act matters (excl. appeals) by year of filing - text version]
| Pre 06/07 | 06/07 | 07/08 | 08/09 | 09/10 | 10/11 |
|---|---|---|---|---|---|
| 2 | 1 | 18 | 27 | 71 | 892 |
Figure 6.8 - Consumer Law matters (excl. competition law and appeals) filed over the last five years
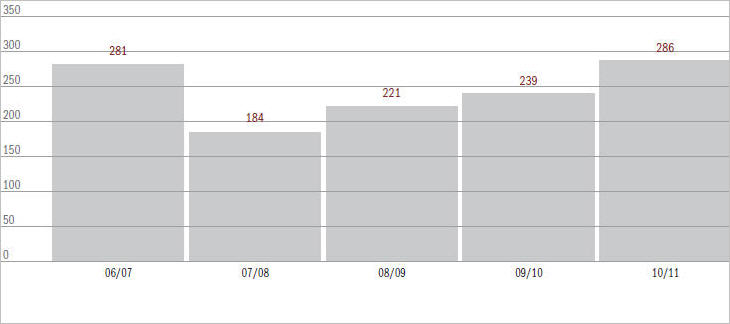
[Figure 6.8 – Consumer Law matters (excl. competition law and appeals) filed over the last five years - text version]
| 06/07 | 07/08 | 08/09 | 09/10 | 10/11 |
|---|---|---|---|---|
| 281 | 184 | 221 | 239 | 286 |
Figure 6.8.1 - Current Consumer Law matters (excl. competition law and appeals) by year of filing
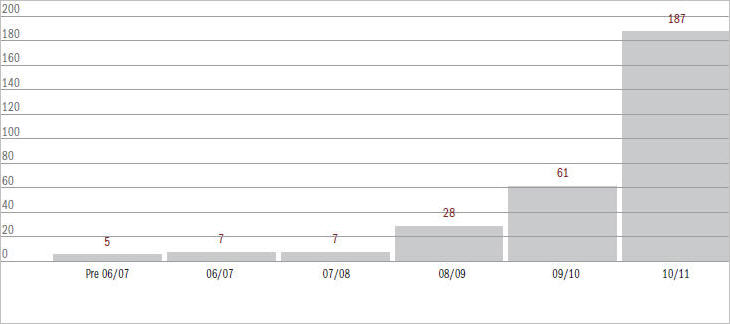
A total of 295 Consumer Law matters remain current as at 30 June 2011.
[Figure 6.8.1 – Current Consumer Law matters (excl. competition law and appeals) by year of filing - text version]
| Pre 06/07 | 06/07 | 07/08 | 08/09 | 09/10 | 10/11 |
|---|---|---|---|---|---|
| 5 | 7 | 7 | 28 | 61 | 187 |
A total of 295 Consumer Law matters remain current as at 30 June 2011.
Figure 6.9 - Migration Act matters (excl. appeals) filed over the last five years
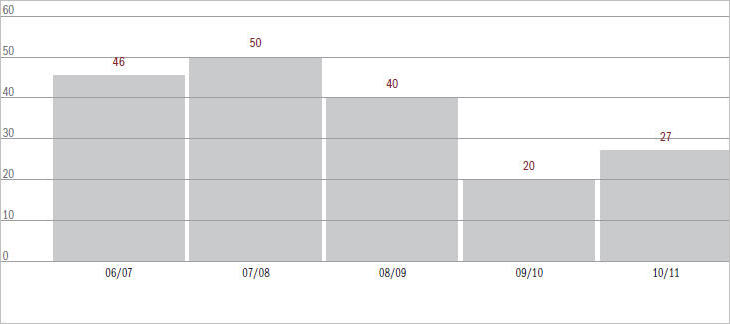
These figures include migration applications filed under the Judiciary Act, Administrative Decisions (Judicial Review) Act and Migration Act.
Since 1 December 2005, when the Migration Litigation Reform Act commenced, almost all first instance migration cases have been filed in the Federal Magistrates Court.
[Figure 6.9 – Migration Act matters (excl. appeals) filed over the last five years - text version]
| 06/07 | 07/08 | 08/09 | 09/10 | 10/11 |
|---|---|---|---|---|
| 46 | 50 | 40 | 20 | 27 |
Figure 6.9.1 - Current Migration Act matters (excl. appeals) by year of filing
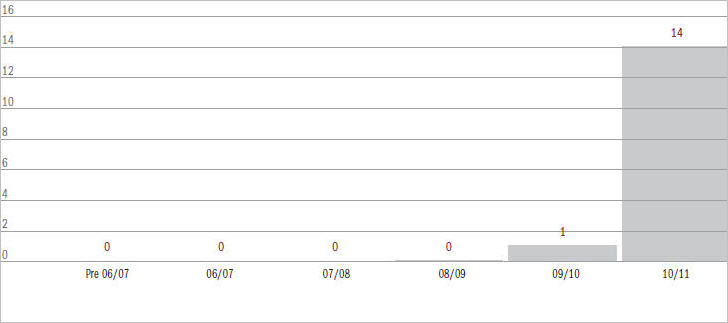
A total of 15 Migration Act matters remain current as at 30 June 2011.
[Figure 6.9.1 – Current Migration Act matters (excl. appeals) by year of filing - text version]
| Pre 06/07 | 06/07 | 07/08 | 08/09 | 09/10 | 10/11 |
|---|---|---|---|---|---|
| 0 | 0 | 0 | 0 | 1 | 14 |
Figure 6.10 - Admiralty Act matters (excl. appeals) filed over the last five years
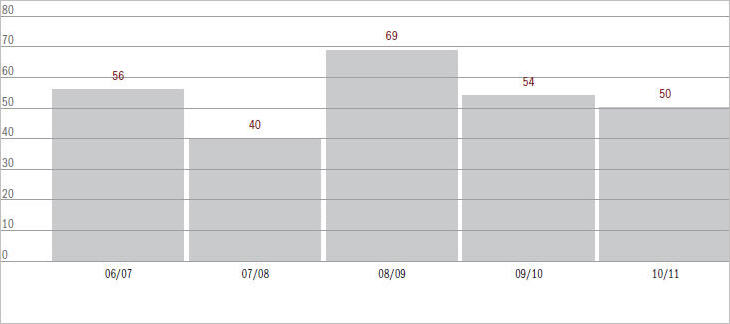
[Figure 6.10 – Admiralty Act matters (excl. appeals) filed over the last five years - text version]
| 06/07 | 07/08 | 08/09 | 09/10 | 10/11 |
|---|---|---|---|---|
| 56 | 40 | 69 | 54 | 50 |
Figure 6.10.1 - Current Admiralty matters (excl. appeals) by year of filing
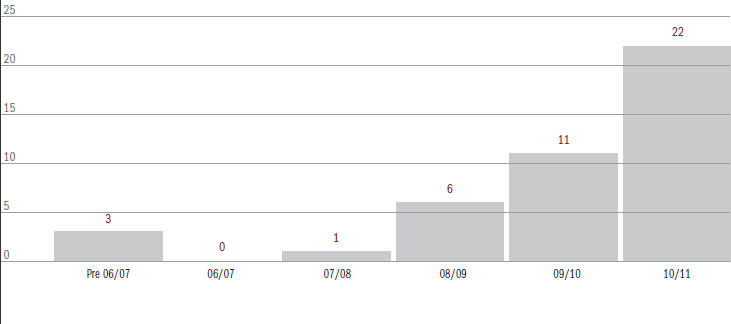
A total of 43 Admiralty Act matters remain current as at 30 June 2011.
[Figure 6.10.1 – Current Admiralty matters (excl. appeals) by year of filing - text version]
| Pre 06/07 | 06/07 | 07/08 | 08/09 | 09/10 | 10/11 |
|---|---|---|---|---|---|
| 3 | 0 | 1 | 6 | 11 | 22 |
A total of 43 Admiralty Act matters remain current as at 30 June 2011.
Figure 6.11 - Native Title Act matters (excl. appeals) filed over the last five years
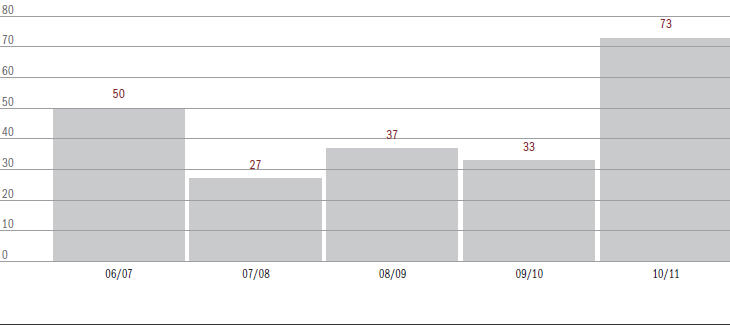
[Figure 6.11 – Native Title Act matters (excl. appeals) filed over the last five years - text version]
| 06/07 | 07/08 | 08/09 | 09/10 | 10/11 |
|---|---|---|---|---|
| 50 | 27 | 37 | 33 | 73 |
Figure 6.11.1 - Current Native Title matters (excl. appeals) by year of filing
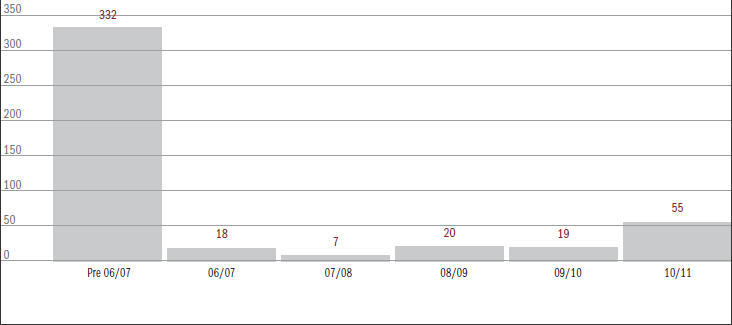
A total of 451 Native Title matters remain current as at 30 June 2011.
[Figure 6.11.1 – Current Native Title matters (excl. appeals) by year of filing - text version]
| Pre 06/07 | 06/07 | 07/08 | 08/09 | 09/10 | 10/11 |
|---|---|---|---|---|---|
| 332 | 18 | 7 | 20 | 19 | 55 |
Figure 6.12 - Workplace Relations/Fair Work matters (excl. appeals) filed over the last five years
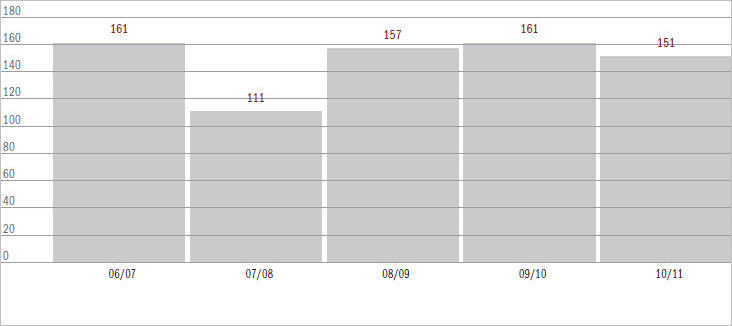
[Figure 6.12 – Workplace Relations/Fair Work matters (excl. appeals) filed over the last five years - text version]
| 06/07 | 07/08 | 08/09 | 09/10 | 10/11 |
|---|---|---|---|---|
| 161 | 111 | 157 | 161 | 151 |
Figure 6.12.1 - Current Workplace Relations/Fair Work matters (excl. appeals) by year of filing
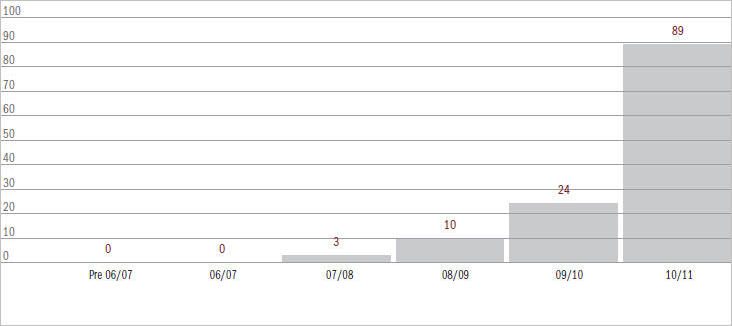
A total of 126 Workplace Relations/Fair Work cases remain current as at 30 June 2011.
[Figure 6.12.1 – Current Workplace Relations/Fair Work matters (excl. appeals) by year of filing - text version]
| Pre 06/07 | 06/07 | 07/08 | 08/09 | 09/10 | 10/11 |
|---|---|---|---|---|---|
| 0 | 0 | 3 | 10 | 24 | 89 |
Figure 6.13 - Taxation matters (excl. appeals) filed over the last five years
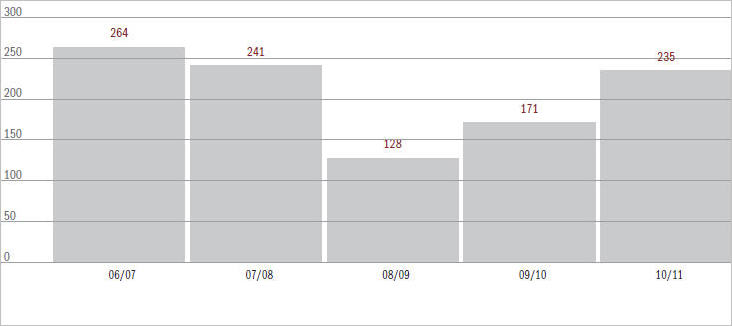
[Figure 6.13 – Taxation matters (excl. appeals) filed over the last five years - text version]
| 06/07 | 07/08 | 08/09 | 09/10 | 10/11 |
|---|---|---|---|---|
| 264 | 241 | 128 | 171 | 235 |
Figure 6.13.1 - Current taxation matters (excl. appeals) by year of filing
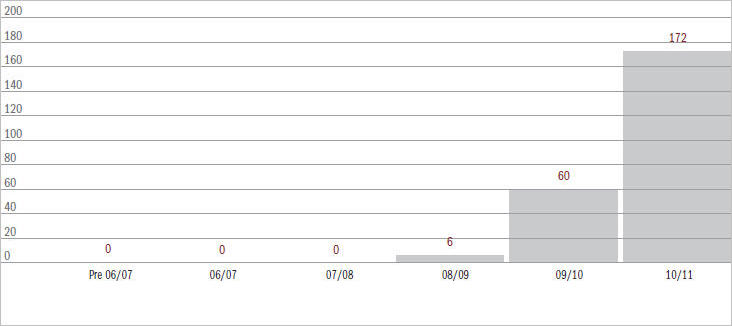
A total of 238 taxation cases remain current as at 30 June 2011.
[Figure 6.13.1 – Current taxation matters (excl. appeals) by year of filing - text version]
| Pre 06/07 | 06/07 | 07/08 | 08/09 | 09/10 | 10/11 |
|---|---|---|---|---|---|
| 0 | 0 | 0 | 6 | 60 | 172 |
Figure 6.14 - Intellectual Property Matters (excl. appeals) filed over the last five years
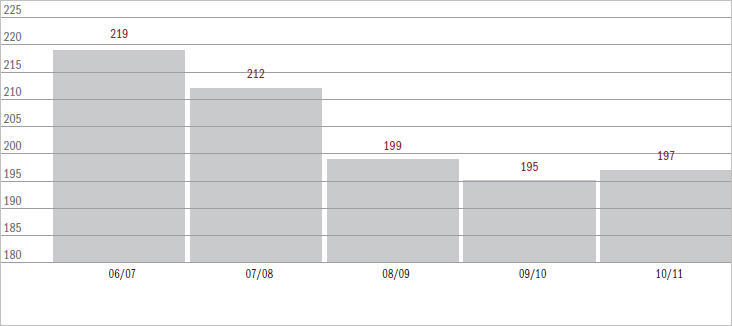
[Figure 6.14 – Intellectual Property Matters (excl. appeals) filed over the last five years - text version]
| 06/07 | 07/08 | 08/09 | 09/10 | 10/11 |
|---|---|---|---|---|
| 219 | 212 | 199 | 195 | 197 |
Figure 6.14.1 - Current Intellectual Property matters (excl. appeals) by year of filing
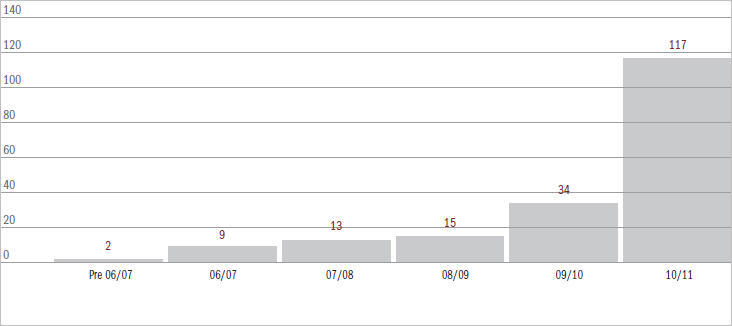
A total of 190 intellectual property cases remain current as at 30 June 2011.
[Figure 6.14.1 – Current Intellectual Property matters (excl. appeals) by year of filing - text version]
| Pre 06/07 | 06/07 | 07/08 | 08/09 | 09/10 | 10/11 |
|---|---|---|---|---|---|
| 2 | 9 | 13 | 15 | 34 | 117 |
Figure 6.15 - Appeals and Related Actions filed over the last five years
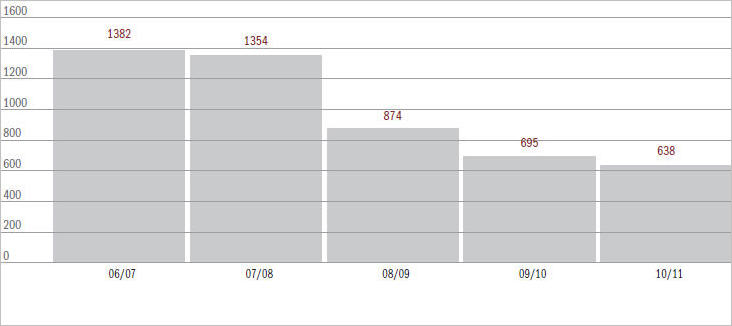
[Figure 6.15 – Appeals and Related Actions filed over the last five years - text version]
| 06/07 | 07/08 | 08/09 | 09/10 | 10/11 |
|---|---|---|---|---|
| 1382 | 1354 | 874 | 695 | 638 |
Figure 6.15.1 - Current Appeals and Related Actions by date filed
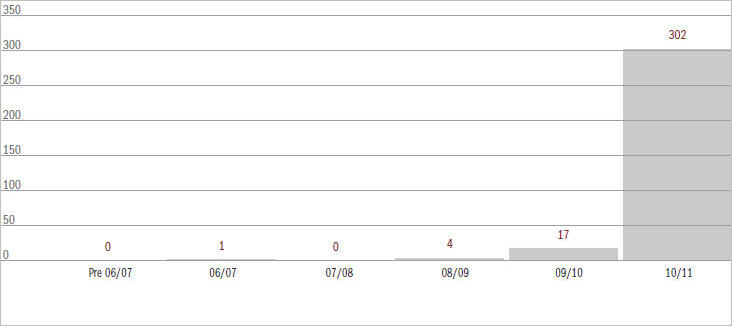
A total of 324 Appeals and Related Actions remain current as at 30 June 2011.
[Figure 6.15.1 – Current Appeals and Related Actions by date filed - text version]
| Pre 06/07 | 06/07 | 07/08 | 08/09 | 09/10 | 10/11 |
|---|---|---|---|---|---|
| 0 | 1 | 0 | 4 | 17 | 302 |
A total of 324 Appeals and Related Actions remain current as at 30 June 2011.
Figure 6.16 - Source of Appeals and Related Actions over the last five years
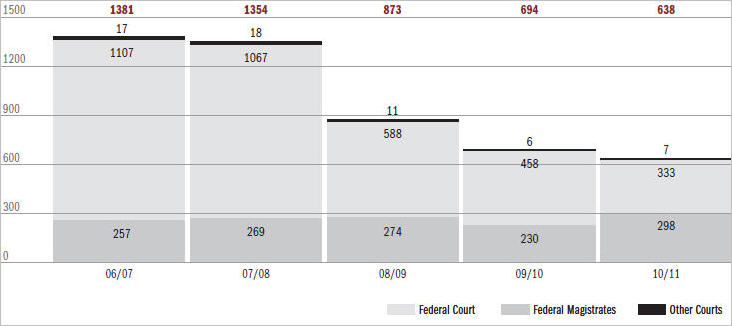
[Figure 6.16 – Source of Appeals and Related Actions over the last five years - text version]
| 06/07 | 07/08 | 08/09 | 09/10 | 10/11 | |
|---|---|---|---|---|---|
| Federal Court | 1107 | 1067 | 588 | 458 | 333 |
| Federal Magistrates | 257 | 269 | 274 | 230 | 298 |
| Other Courts | 17 | 18 | 11 | 6 | 7 |
| TOTAL | 1381 | 1354 | 873 | 694 | 638 |
Table 6.6 - Appeals and Related Actions
| Source | 2006-07 | 2007-08 | 2008-09 | 2009-10 | 2010-11 | |||||
|---|---|---|---|---|---|---|---|---|---|---|
| Federal Court | 257 | 18.6% | 269 | 19.9% | 274 | 31.4% | 230 | 33.1% | 298 | 46.7% |
| Federal Magistrates Court | 1107 | 80.2% | 1067 | 78.8% | 588 | 67.4% | 458 | 66.0% | 333 | 52.2% |
| Other Courts | 17 | 1.2% | 18 | 1.3% | 11 | 1.3% | 6 | 0.9% | 7 | 1.1% |
| Total by Period | 1381 | 1354 | 873 | 694 | 638 | |||||