
Appendix 5: Workload Statistics
Federal Court of Australia Annual Report 2016-2017
The statistics in this appendix provide comparative historical information on the work of the Court, including in certain areas of the Court’s jurisdiction.
When considering the statistics it is important to note that matters vary according to the nature and complexity of the issues in dispute.
It should also be noted that the figures reported in this report may differ from figures reported in previous years. The variations have occurred through refinements or enhancements to the Casetrack database which necessitated the checking or verification and possible variation of data previously entered.
Casetrack records matters in the Court classified according to 16 main categories, described as ‘causes of action’ (CoA). The classification of matters in this way causes an under representation of the workload as it does not include filings of supplementary CoAs (cross appeals and cross claims), interlocutory applications or Native Title joinder of party applications.
In 2007–08 the Court started to count and report on interlocutory applications (including interim applications and notices of motion) in appellate proceedings in order to provide the most accurate possible picture of the Court’s appellate workload. From 2008–09 the Court has counted all forms of this additional workload in both its original and appellate jurisdictions.
Table A5.4 on page 141 provides a breakdown of these matters. At this stage it is not possible to obtain information about finalisations of interlocutory applications (because they are recorded in the Court’s case management system as a document filed rather than a specific CoA). Because of this, detailed reporting of these matters has been restricted to the information about appeals in Part 3 and Table A5.4.
In 2015, the National Court Framework reforms were introduced. The Court began reporting on matters by seven main National Practice Areas (NPAs) last financial year. A further two NPAs were introduced during 2016–17. This information can be found in Figure A5.9 onwards.
Table A5.1: Summary of workload statistics – original and appellate jurisdictions – filings of major CoAs (including appellate and related actions)
| Cause of Action | 2012–13 | 2013–14 | 2014–15 | 2015–16 | 2016–17 |
|---|---|---|---|---|---|
| Total CoAs (including appeals and related actions) | |||||
| Filed | 5803 | 5009 | 4355 | 6001 | 5695 |
| Finalised | 5513 | 5564 | 3886 | 5832 | 5627 |
| Current | 3022 | 2467 | 2936 | 3105 | 3173 |
| Corporations (including appeals and related actions) | |||||
| Filed | 3897 | 2905 | 2210 | 3687 | 3216 |
| Finalised | 3499 | 3390 | 1859 | 3488 | 3377 |
| Current | 1041 | 556 | 907 | 1106 | 945 |
| Bankruptcy (including appeals and related actions) | |||||
| Filed | 216 | 281 | 260 | 292 | 348 |
| Finalised | 212 | 257 | 249 | 264 | 327 |
| Current | 110 | 134 | 145 | 173 | 194 |
| Native Title (including appeals and related actions) | |||||
| Filed | 61 | 58 | 64 | 65 | 70 |
| Finalised | 82 | 110 | 75 | 135 | 93 |
| Current | 465 | 413 | 402 | 332 | 309 |
| Total CoAs (including appeals and related actions excluding Corporations, Bankruptcy and Native Title) | |||||
| Filed | 1629 | 1765 | 1821 | 1957 | 2061 |
| Finalised | 1720 | 1807 | 1703 | 1945 | 1830 |
| Current | 1406 | 1364 | 1482 | 1494 | 1725 |
Table A5.2: Summary of workload statistics – excluding appeals and related actions – filings of major CoAs (excluding appeals and related actions)
| Cause of Action | 2012–13 | 2013–14 | 2014–15 | 2015–16 | 2016–17 |
|---|---|---|---|---|---|
| Total CoAs (excluding appeals and related actions) | |||||
| Filed | 5169 | 4281 | 3445 | 5008 | 4650 |
| Finalised | 4884 | 4876 | 3138 | 4883 | 4742 |
| Current | 2729 | 2134 | 2441 | 2566 | 2474 |
| Corporations (excluding appeals and related actions) | |||||
| Filed | 3849 | 2876 | 2185 | 3652 | 3194 |
| Finalised | 3459 | 3351 | 1837 | 3462 | 3351 |
| Current | 1015 | 540 | 888 | 1078 | 921 |
| Bankruptcy (excluding appeals and related actions) | |||||
| Filed | 174 | 219 | 205 | 231 | 286 |
| Finalised | 163 | 198 | 186 | 218 | 269 |
| Current | 83 | 104 | 123 | 136 | 153 |
| Native Title (excluding appeals and related actions) | |||||
| Filed | 50 | 44 | 55 | 58 | 53 |
| Finalised | 75 | 100 | 68 | 123 | 82 |
| Current | 458 | 402 | 389 | 324 | 295 |
| Total CoAs (excluding appeals and related actions and excluding bankruptcy and native title) | |||||
| Filed | 1096 | 1142 | 1000 | 1067 | 1117 |
| Finalised | 1187 | 1227 | 1047 | 1080 | 1040 |
| Current | 1173 | 1088 | 1041 | 1028 | 1105 |
Table A5.3: Summary of workload statistics – appeals and related actions only – filings of appeals and related actions
| Cause of Action | 2012–13 | 2013–14 | 2014–15 | 2015–16 | 2016–17 |
|---|---|---|---|---|---|
| Total appeals and related actions | |||||
| Filed | 634 | 728 | 910 | 993 | 1045 |
| Finalised | 629 | 688 | 748 | 949 | 885 |
| Current | 293 | 333 | 495 | 539 | 699 |
| Corporations appeals and related actions | |||||
| Filed | 48 | 29 | 25 | 35 | 22 |
| Finalised | 40 | 39 | 22 | 26 | 26 |
| Current | 26 | 16 | 19 | 28 | 24 |
| Migration appeals and related actions | |||||
| Filed | 278 | 370 | 648 | 653 | 763 |
| Finalised | 255 | 356 | 463 | 681 | 584 |
| Current | 108 | 122 | 307 | 279 | 458 |
| Native Title appeals and related actions | |||||
| Filed | 11 | 14 | 9 | 7 | 17 |
| Finalised | 7 | 10 | 7 | 12 | 11 |
| Current | 7 | 11 | 13 | 8 | 14 |
| Total appeals and related actions (excluding Corporations, Migration and Native Title appeals and related actions) | |||||
| Filed | 297 | 315 | 228 | 298 | 243 |
| Finalised | 327 | 283 | 256 | 230 | 264 |
| Current | 152 | 184 | 156 | 224 | 203 |
Table A5.4: Summary of supplementary workload statistics – filings of supplementary causes of action
| 2012–13 | 2013–14 | 2014–15 | 2015–16 | 2016–17 | |
|---|---|---|---|---|---|
| Total CoAs (excluding appeals and related actions) | |||||
| Cross appeals (original jurisdiction) | 0 | 0 | 0 | 0 | 0 |
| Cross claims | 165 | 177 | 134 | 135 | 147 |
| Interlocutory applications | 1673 | 1541 | 1513 | 1530 | 1502 |
| Native Title (NT) Joinder of party applications | 628 | 405 | 982 | 781 | 346 |
| Appeals and related actions | |||||
| Cross appeals | 16 | 25 | 25 | 19 | 20 |
| Interlocutory applications | 138 | 135 | 172 | 192 | 219 |
| Total actions (including appeals and related actions) | |||||
| Cross appeals | 16 | 25 | 25 | 19 | 20 |
| Cross Claims | 165 | 177 | 134 | 135 | 147 |
| Interlocutory applications | 1811 | 1676 | 1685 | 1722 | 1721 |
| Native Title (NT) Joinder of party applications | 628 | 405 | 982 | 781 | 346 |
| Totals | 1992 | 1878 | 1844 | 1876 | 1888 |
Figure A5.1: Matters filed over the last five years
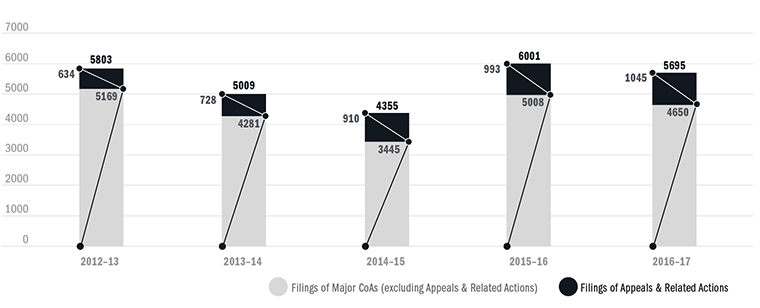
Figure A5.2: Matters filed and finalised over the last five years

The number finalised refers to those matters finalised in the relevant financial year, regardless of when they were originally filed.
Figure A5.3: Age and number of current matters at 30 June 2017
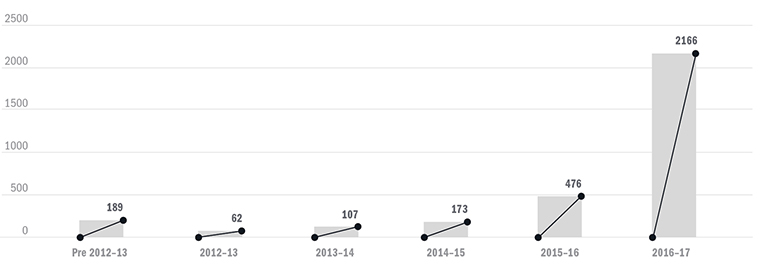
A total of 3173 matters remain current at 30 June 2017. There were 189 applications still current relating to periods before 2012-13. Six per cent of cases prior to 2012-13 are native title matters.
Figure A5.4: Time span to complete – matters completed (excluding native title) over the last five years
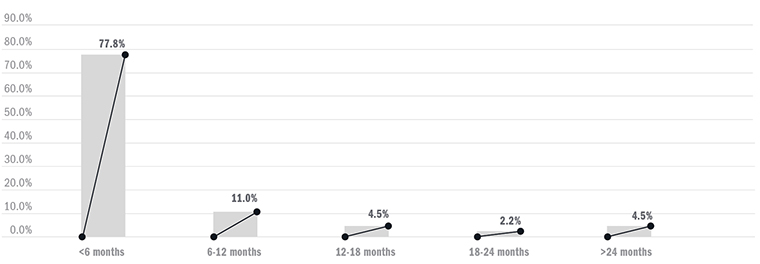
A total of 25,974 matters were completed during the five-year period ending 30 June 2017, excluding native title matters. The time span, from filing to disposition of these matters, is shown in Figure A5.4 above.
Figure A5.5: Time span to complete against the 85% benchmark (excluding native title) over the last five years

The Court has a benchmark of 85 per cent of cases (excluding native title) being completed within 18 months of commencement. Figure A5.5 sets out the Court’s performance against this time goal over the last five years. The total number of matters (including appeals but excluding Native Title) completed for each of the last five years and the time spans for completion are shown in Table A5.5.
Table A5.5: Finalisation of major CoAs in accordance with 85% benchmark (including appeals and related actions and excluding native title matters) over the last five years
| Percentage completed | 2012–13 | 2013–14 | 2014–15 | 2015–16 | 2016–17 |
|---|---|---|---|---|---|
| Under 18 months | 5033 | 5067 | 3537 | 5374 | 5204 |
| % of total | 92.6% | 92.7% | 92.6% | 94.1% | 93.9% |
| Over 18 months | 405 | 397 | 281 | 335 | 341 |
| % of total | 7.4% | 7.3% | 7.4% | 5.9% | 6.1% |
| Total CoAs | 5438 | 5464 | 3818 | 5709 | 5545 |
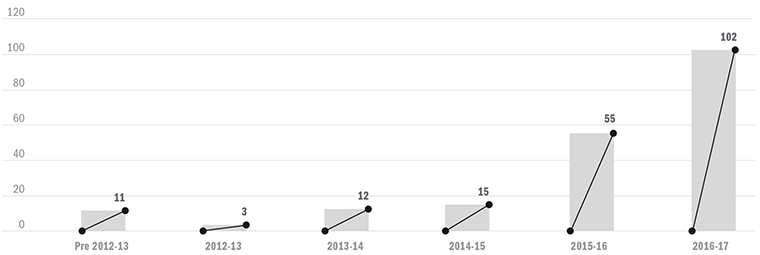
Figure A5.6: Bankruptcy Act matters (excluding appeals) filed over the last five years

Figure A5.6.1: Current Bankruptcy Act matters (excluding appeals) by year of filing

Figure A5.7: Corporation Act matters (excluding appeals) filed over the last five years

Figure A5.7.1: Current Corporation matters (excluding appeals) by year of filing
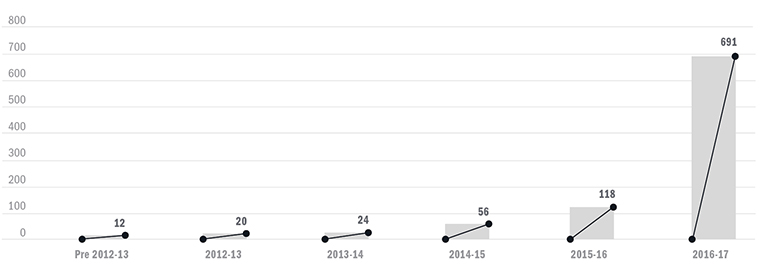
Figure A5.8: Consumer law matters (excluding competition law and appeals) filed over the last five years
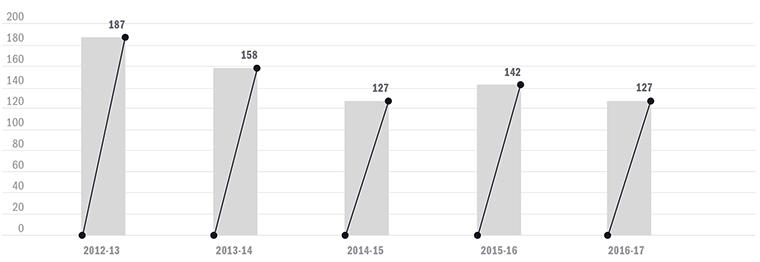
Figure A5.8.1: Current consumer law matters (excluding competition law and appeals) by year of filing
National Court Framework
Figure A5.9: Filings, finalisations and pending
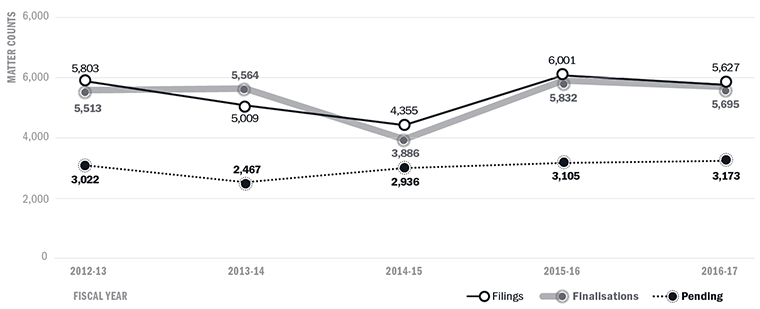
Figure A5.9.1: All filings, finalisations and pending by Administrative and Constitutional Law and Human Rights NPA
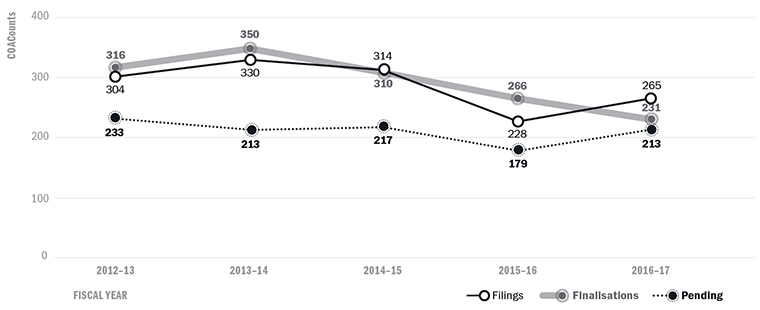
Figure A5.9.2: All filings, finalisation and pending by Admiralty and Maritime NPA
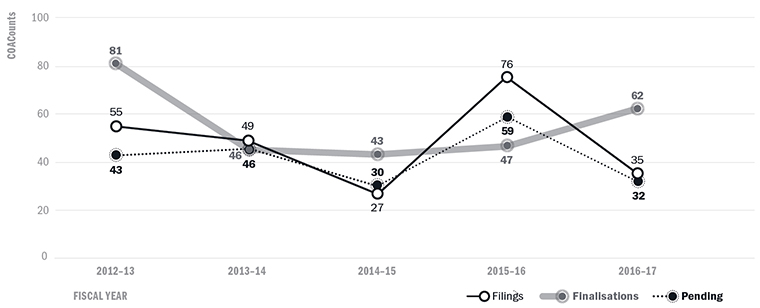
Figure A5.9.3: All filings, finalisation and pending by Commercial and Corporations NPA
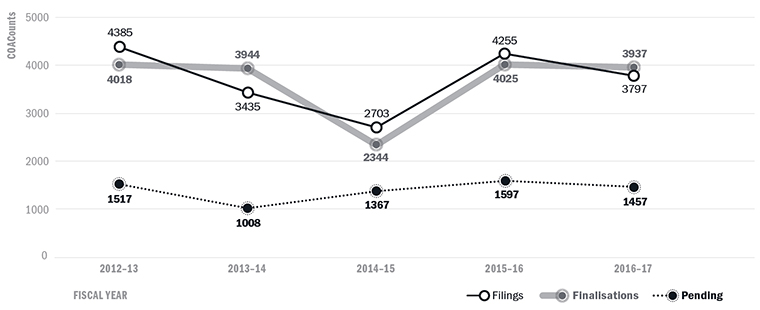
Figure A5.9.4: All filings, finalisation and pending by Employment and Industrial Relations NPA
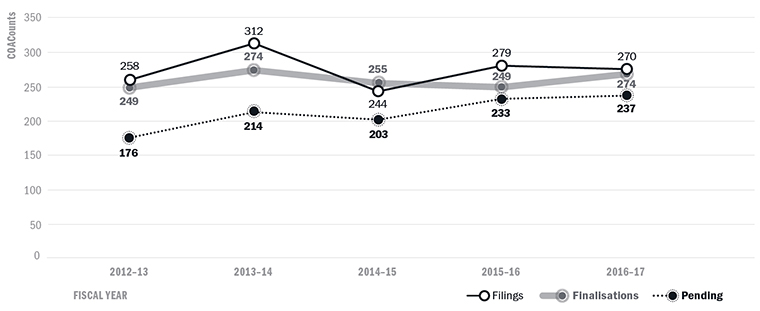
Figure A5.9.5: All filings, finalisation and pending by Intellectual Property NPA
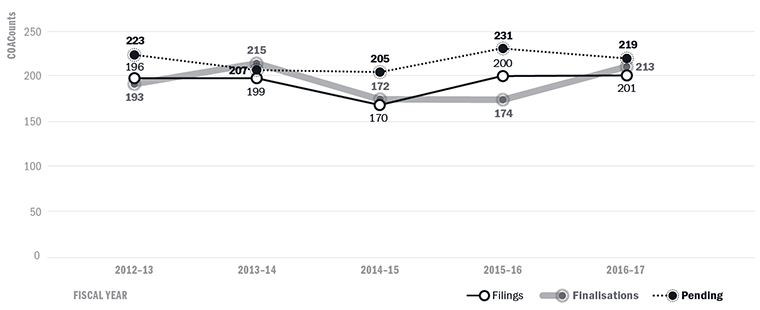
Figure A5.9.6: All filings, finalisation and pending by Native Title NPA
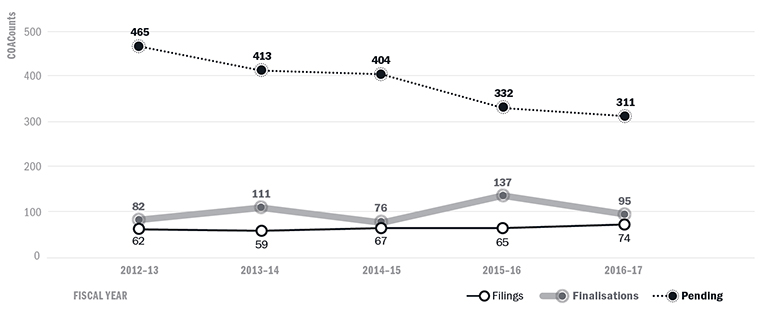
Figure A5.9.7: All filings, finalisation and pending by Taxation NPA
In 2016–17 the Court introduced two new practice areas: other federal jurisdiction and federal crime and related proceedings.
Table A5.6: Other federal jurisdiction, filings, finalisations and pending, 2016–17
| Filings | Finalisation | Pending |
|---|---|---|
| 27 | 4 | 23 |
Table A5.7: Federal crime and related proceedings, filings, finalisations and pending, 2016–17
| Filings | Finalisation | Pending |
|---|---|---|
| 6 | 1 | 5 |